Is Inflation Whupped?
This week inflation hit its lowest point since 2021 at 2.9% overall. As controversial as saying “inflation is going down” has been, inflation is on the decline. And to be clear, this doesn’t mean prices are going down – that’s deflation.
It just means that prices are going up more slowly than they were a year ago.
So, with inflation on the decline, many are watching the Federal Reserve to see when they will lower their interest rates. What could that mean for us? Well, it depends. But let’s look at a few things.
Odds of a Rate Cut
Source: https://www.cmegroup.com/markets/interest-rates/cme-fedwatch-tool.html
As of 8/14/2024, CME Group has a 100% probability that the Fed will cut rates at their September meeting. This number changes daily but it’s been trending at the 100% rate for several weeks now. The question has moved from “Will they cut rates?” to “How much will they cut rates?”.
The odds of a .25% (25bps for those in the know) cut are 64.5% and the odds of a .50% cut are 35.5%.
All this means that we’re very likely to see a Fed rate cut next month and it’s probably going to be small – either .25% or .50%.
The Fed Cuts…Then What?
It Depends on Why They Cut
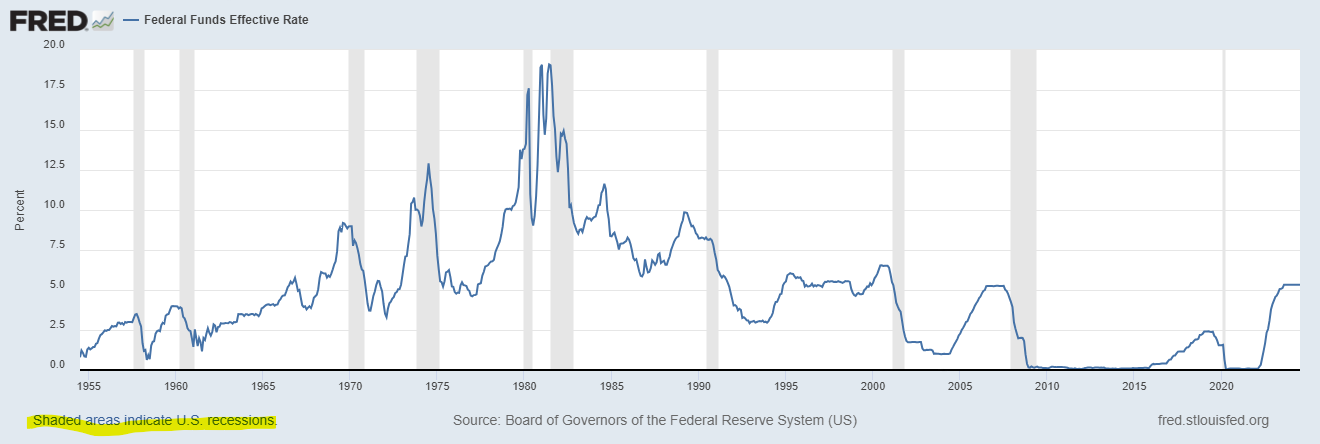
Source: Federal Reserve
First, it depends on why the Fed cuts rates. The chart below shows the history of the Fed funds rate. The gray bars on the timeline represent recessions. The biggest thing to notice is the last three Fed rate cuts were followed by a recession within the next 12 months. It’s certainly debatable whether the 2020 recession was related to Fed rate cuts.
But the bottom line is the Fed cutting rates in recent history has not been cause for celebration.
Is this time different? It certainly could be. That’s why predicting these things is so hard (I’d say impossible).
Cash (CD’s, High-Yield Savings, Money Markets)
This one’s pretty straightforward. Rates on these accounts will go down when the Fed lowers rates.
Recently, these accounts have become a security blanket of sorts. I’ve had many, many conversations that basically go, “why would I invest in the markets, when I can get 5% on my cash?”.
The blanket is not going to be completely taken away with this cut but its warm and cuddly days are likely numbered.

Stocks and Bonds
This one is much less straightforward. But here’s a maxim in almost all things investing in highly liquid markets (i.e., markets that trade a lot): It’s not bad or good, it’s better or worse.
What this means is the markets have already priced in expectations. If those expectations are met, then the market won’t react much. But if those expectations aren’t met (i.e., better or worse) then it will react more strongly.
So, in our case the markets are expecting a .25% cut and wouldn’t be shocked by a .50% rate cut per the chart earlier. If that cut comes to fruition, apart from any other news (a big if), don’t expect stock or bond markets to react too materially. However, if the Fed doesn’t cut or cuts a full 1%, then there would likely be a bigger swing. Because those expectations have not been priced in.
So, with that, independent of any other events (again, a big if), most of the rate cut expectations have already been priced in. This means current prices already reflect that information.
If you’re interested in what’s happened historically the chart below is very helpful.
The big takeaway? Historically, the 12 months after the Fed cuts rates, stocks have mostly experienced positive returns EXCEPT when followed by a recession.
On a related note, that’s why you saw a small correction in early August when the jobs report came in lower than expected – people were concerned we might be headed for a recession.
Bonds have generally fared better in recessionary environments. Typically, in a recessionary environment, investors flee to the safety of bonds which drives up their value.
Figure 1
Stocks Have Outperformed Bonds, and Bonds Have Outperformed Cash When the Fed Starts Cutting Rates
12-month real returns from the date of first cut
As of 12/23. Past performance does not guarantee future results. Indices are unmanaged and not available for direct investment. See below for representative index definitions. * Indicates that a recession occurred within 12 months. Return Data Sources: CFA Institute, SBBI database, and Schroders. Fed Funds Data Sources (1928-1954): New York Tribune and The Wall Street Journal via FRED in which a 7-day average has been taken to remove daily volatility, an approach consistent with the methodology of the St. Louis Fed. Fed Funds Data Source (1955-2023): FRED.
What Should You Do?
So, what should you do with this upcoming cut? Drumroll…………probably the same thing you were doing prior.
For cash, this means keeping any short-term needs in reserve through high-yield savings, money markets, CDs, etc. These are your first line of defense when an unexpected bill pops up, vacations, vehicle purchases, etc. occur.
Next, your investment portfolio should be there for the long-term. As long as it your objectives and risk-tolerance are the same, then changes likely aren’t needed.
Like most things in life, a disciplined, thoughtful approach is usually the most effective.
Disclosure: The views expressed in this article are those of the author as an individual and do not necessarily reflect the views of the author’s employer Astoria Strategic Wealth, Inc. The research included and/or linked in the article is for informational and illustrative purposes. Past performance is no guarantee of future results. Performance reported gross of fees. You cannot invest in an index. The author may have money invested in funds mentioned in this article. This post is educational in nature and does not constitute investment advice. Please see an investment professional to discuss your particular circumstances.


